Claim: “Sub-Saharan Africans have a Substantially lower average IQ than other groups”
Accuracy Assessment: Largely True
The empirical fact that measured cognitive test scores in Sub-Saharan Africa (SSA) are substantially lower than those in Western Europe, East Asia, and most other world regions is supported by every major academic dataset and international educational assessment, regardless of significant methodological disputes about the exact magnitude of the gap. The claim explicitly disclaims any assertion of genetic causation — it addresses only the empirical measurement.
The central academic debate is not whether SSA scores are lower, but how much lower. Richard Lynn and David Becker’s national IQ database estimates a SSA average of approximately 69–70 IQ points, while Jelte Wicherts’ rigorous 2010 systematic review, which applied stricter sample-representativeness criteria, arrived at approximately 80 IQ points. Even the most optimistic defensible estimate (~80) represents a gap of roughly 1.3 standard deviations below European norms and 1.7 standard deviations below East Asian norms — both comfortably described as “substantial” by any conventional standard.
Independent of IQ databases, international educational assessments (TIMSS 2023) and World Bank learning-poverty metrics confirm that SSA performs at the bottom of every global ranking, with 86% of SSA children classified as “learning poor” compared to the global average of 57%. Crucially, these score gaps are consistent with the hypothesis that large environmental deficits — malnutrition, high infectious-disease burden, iodine deficiency, poor educational quality, and limited access to cognitively stimulating environments — explain a substantial portion of the observed difference. The Flynn effect has been documented in SSA (Kenya study), demonstrating that scores rise with improving conditions. SSA African immigrant groups in the UK (Nigerians, Ghanaians, Yoruba) often outperform the UK average on GCSEs, further supporting a significant environmental component.
The claim is assessed Largely True rather than simply True because: (a) the exact IQ figure is genuinely disputed across a 10–15 point range, and (b) the word “other groups” requires the caveat that SSA scores are not uniformly lower than every other group in every context — SSA immigrants in high-resource environments frequently close much of the apparent gap.
Key Claims at a Glance
| Claim | Assessment |
|---|---|
| Measured cognitive test scores in SSA are lower than in Western countries | ✅ True — confirmed by all major academic datasets, TIMSS 2023, World Bank metrics |
| The gap is “substantial” — not trivial | ✅ True — even the most generous estimate (~80 vs ~100) is ~1.3 SD; Lynn/Becker give ~2 SD |
| SSA scores are lower than those of other world regions | ✅ True — SSA is the lowest-scoring world region in every major database |
| The gap is an observed fact independent of genetic causation | ✅ True — environmental factors (nutrition, disease, education) are strong established predictors |
| Lynn’s specific IQ estimates (~69) are reliable and uncontested | ❌ False — criticised for unrepresentative samples; Wicherts’ systematic review found ~80 |
| SSA Africans in high-resource environments perform just as poorly | ❌ False — Nigerian/Ghanaian UK immigrants often outperform UK national average on GCSEs |
Claim Breakdown
1. “Measured cognitive test scores in SSA are lower than Western norms”
✅ True — no credible academic source disputes the existence of a large score gap
Every major study — regardless of ideological orientation — confirms that SSA populations score substantially lower on cognitive tests normed against Western populations. The debate is about the exact magnitude, not the direction.
Lynn & Becker (2019) — The Intelligence of Nations: The most comprehensive national IQ database, drawing on hundreds of studies: SSA average ~69 IQ. Lynn and Becker’s prior 2012 data similarly found SSA averaging approximately 70. These figures use British IQ norms (UK = 100, SD = 15). Critics (see sub-claim 5) dispute the representativeness of samples included.
Wicherts, Dolan & van der Maas (2010) — Systematic Literature Review: Published in Intelligence, this is the most methodologically rigorous counter-analysis. Wicherts et al. argued Lynn excluded studies because they yielded higher scores. Including studies Lynn excluded, they calculated a SSA average of approximately 80 IQ when compared to Western norms. Even this “higher” estimate is substantially below European (~100) and East Asian (~105) norms.
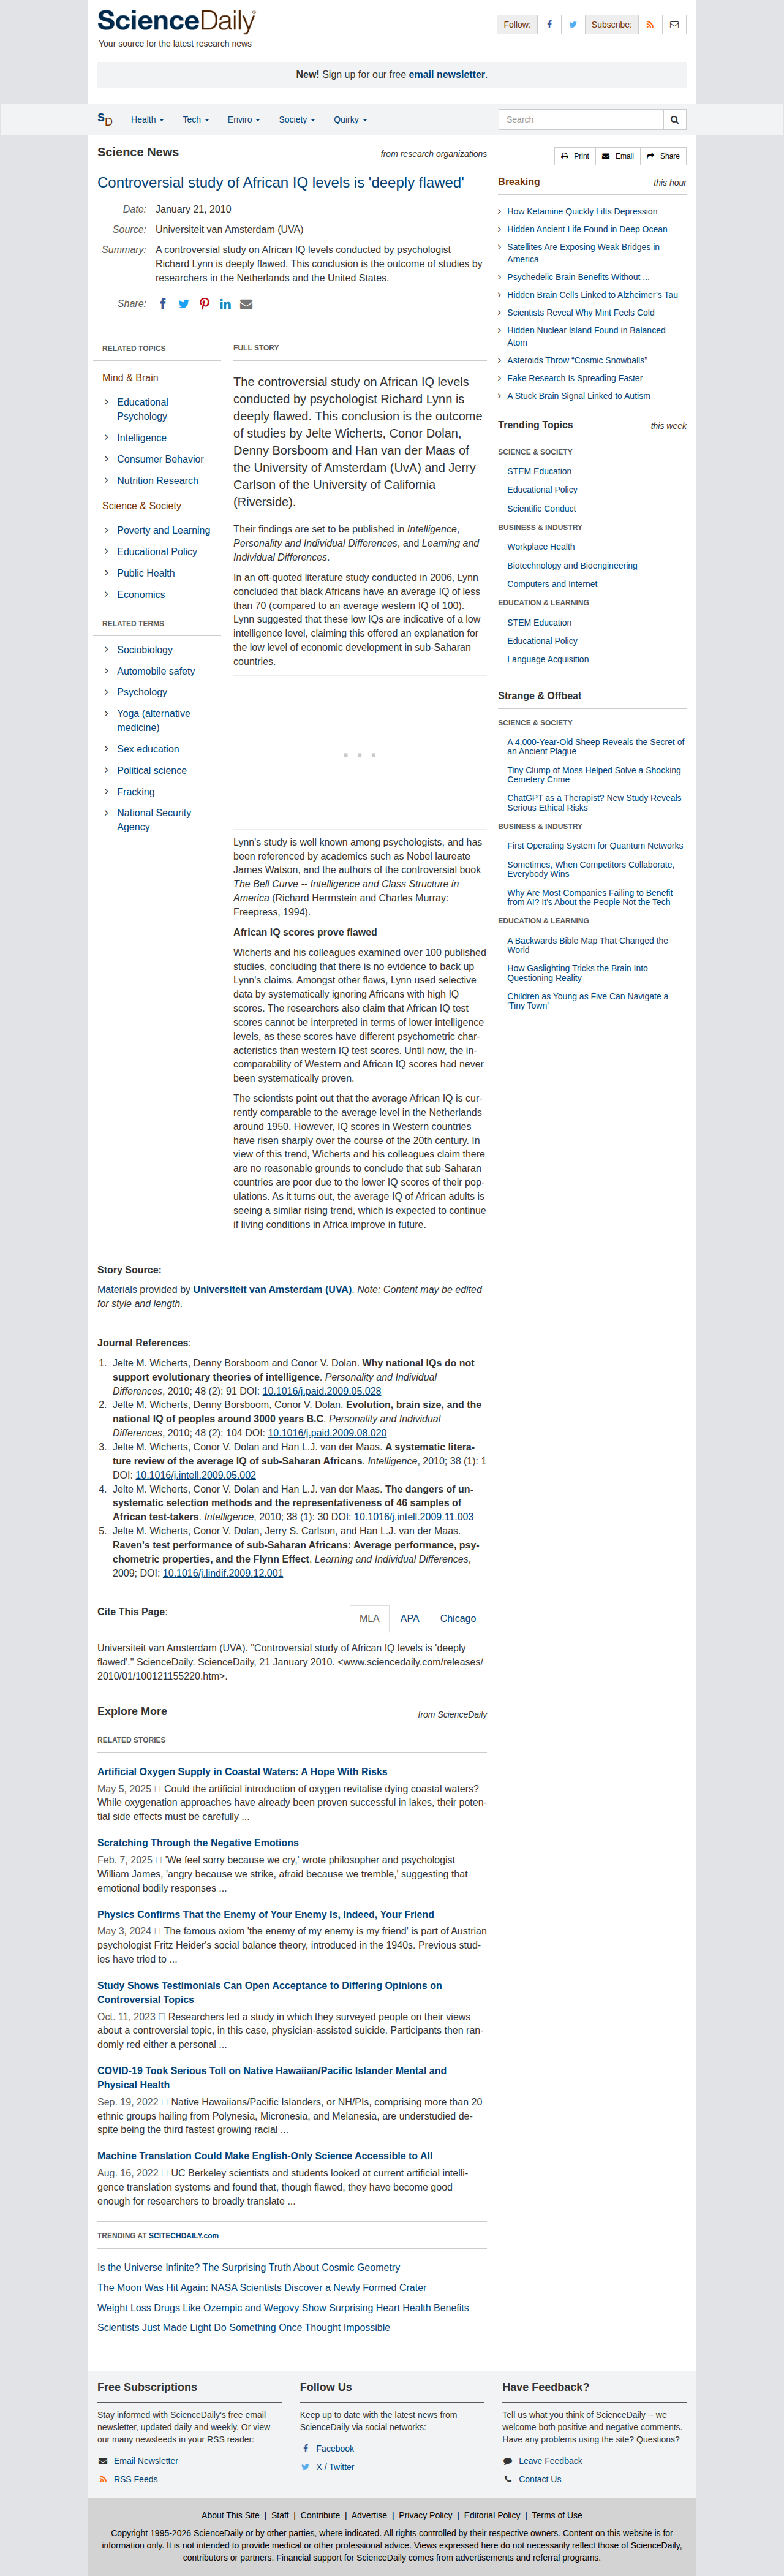
As summarised on ScienceDaily: “In an oft-quoted literature study conducted in 2006, Lynn concluded that black Africans have an average IQ of less than 70 (compared to an average western IQ of 100)… [But the Wicherts review found] an average IQ of about 80.”
Rindermann (2007/2013) — Student Assessment Studies: Using TIMSS, PISA, and PIRLS data rather than IQ databases, Rindermann independently confirmed that SSA has the lowest cognitive ability scores of any world region, with scores ranging approximately 70–75 IQ equivalent. Rindermann’s analysis found “a correlation of .60 between cognitive skill and GDP per capita” and the same regional hierarchy as Lynn’s data.
Expert Survey (Rindermann, Becker & Coyle, 2016 — PMC): 71 published intelligence researchers were surveyed. The study confirmed: “The lowest ability levels are found in sub-Saharan Africa, the highest levels in East Asia, and moderate to high levels in Europe and other developed countries.” Education was rated as the most important cause; genes second; health a major factor for SSA specifically.
Verdict: ✅ True. Every major academic dataset confirms lower cognitive test scores in SSA. The gap is universally acknowledged — the debate is about magnitude and causes.
2. “The gap is ‘substantial’ — not trivial”
✅ True — even the most optimistic estimate represents a very large gap by any statistical standard
The word “substantial” is not scientifically defined, but in psychometric terms, a difference of more than 0.5 SD is generally considered “large.” By this standard, the SSA score gap is substantial under every reasonable estimate:
| Estimate | SSA IQ | European Norm | Gap (SD) | Source |
|---|---|---|---|---|
| Lynn/Becker (2019) | ~69 | ~100 | ~2.0 SD | Lynn & Becker database |
| Wicherts (2010) | ~80 | ~100 | ~1.3 SD | Systematic review |
| Rindermann (2013) | ~75 | ~100 | ~1.7 SD | TIMSS/PISA analysis |
| Parra (2025) | ~70 | Europeans ~95 | ~1.7 SD | OpenPsych synthesis |
Note: 1 SD = 15 IQ points on the standard scale.
Even Wicherts — the most methodologically cautious critic of Lynn — found a gap of ~20 IQ points (~1.3 SD). In educational testing, this is a massive difference: it corresponds to approximately 3–4 years of schooling.
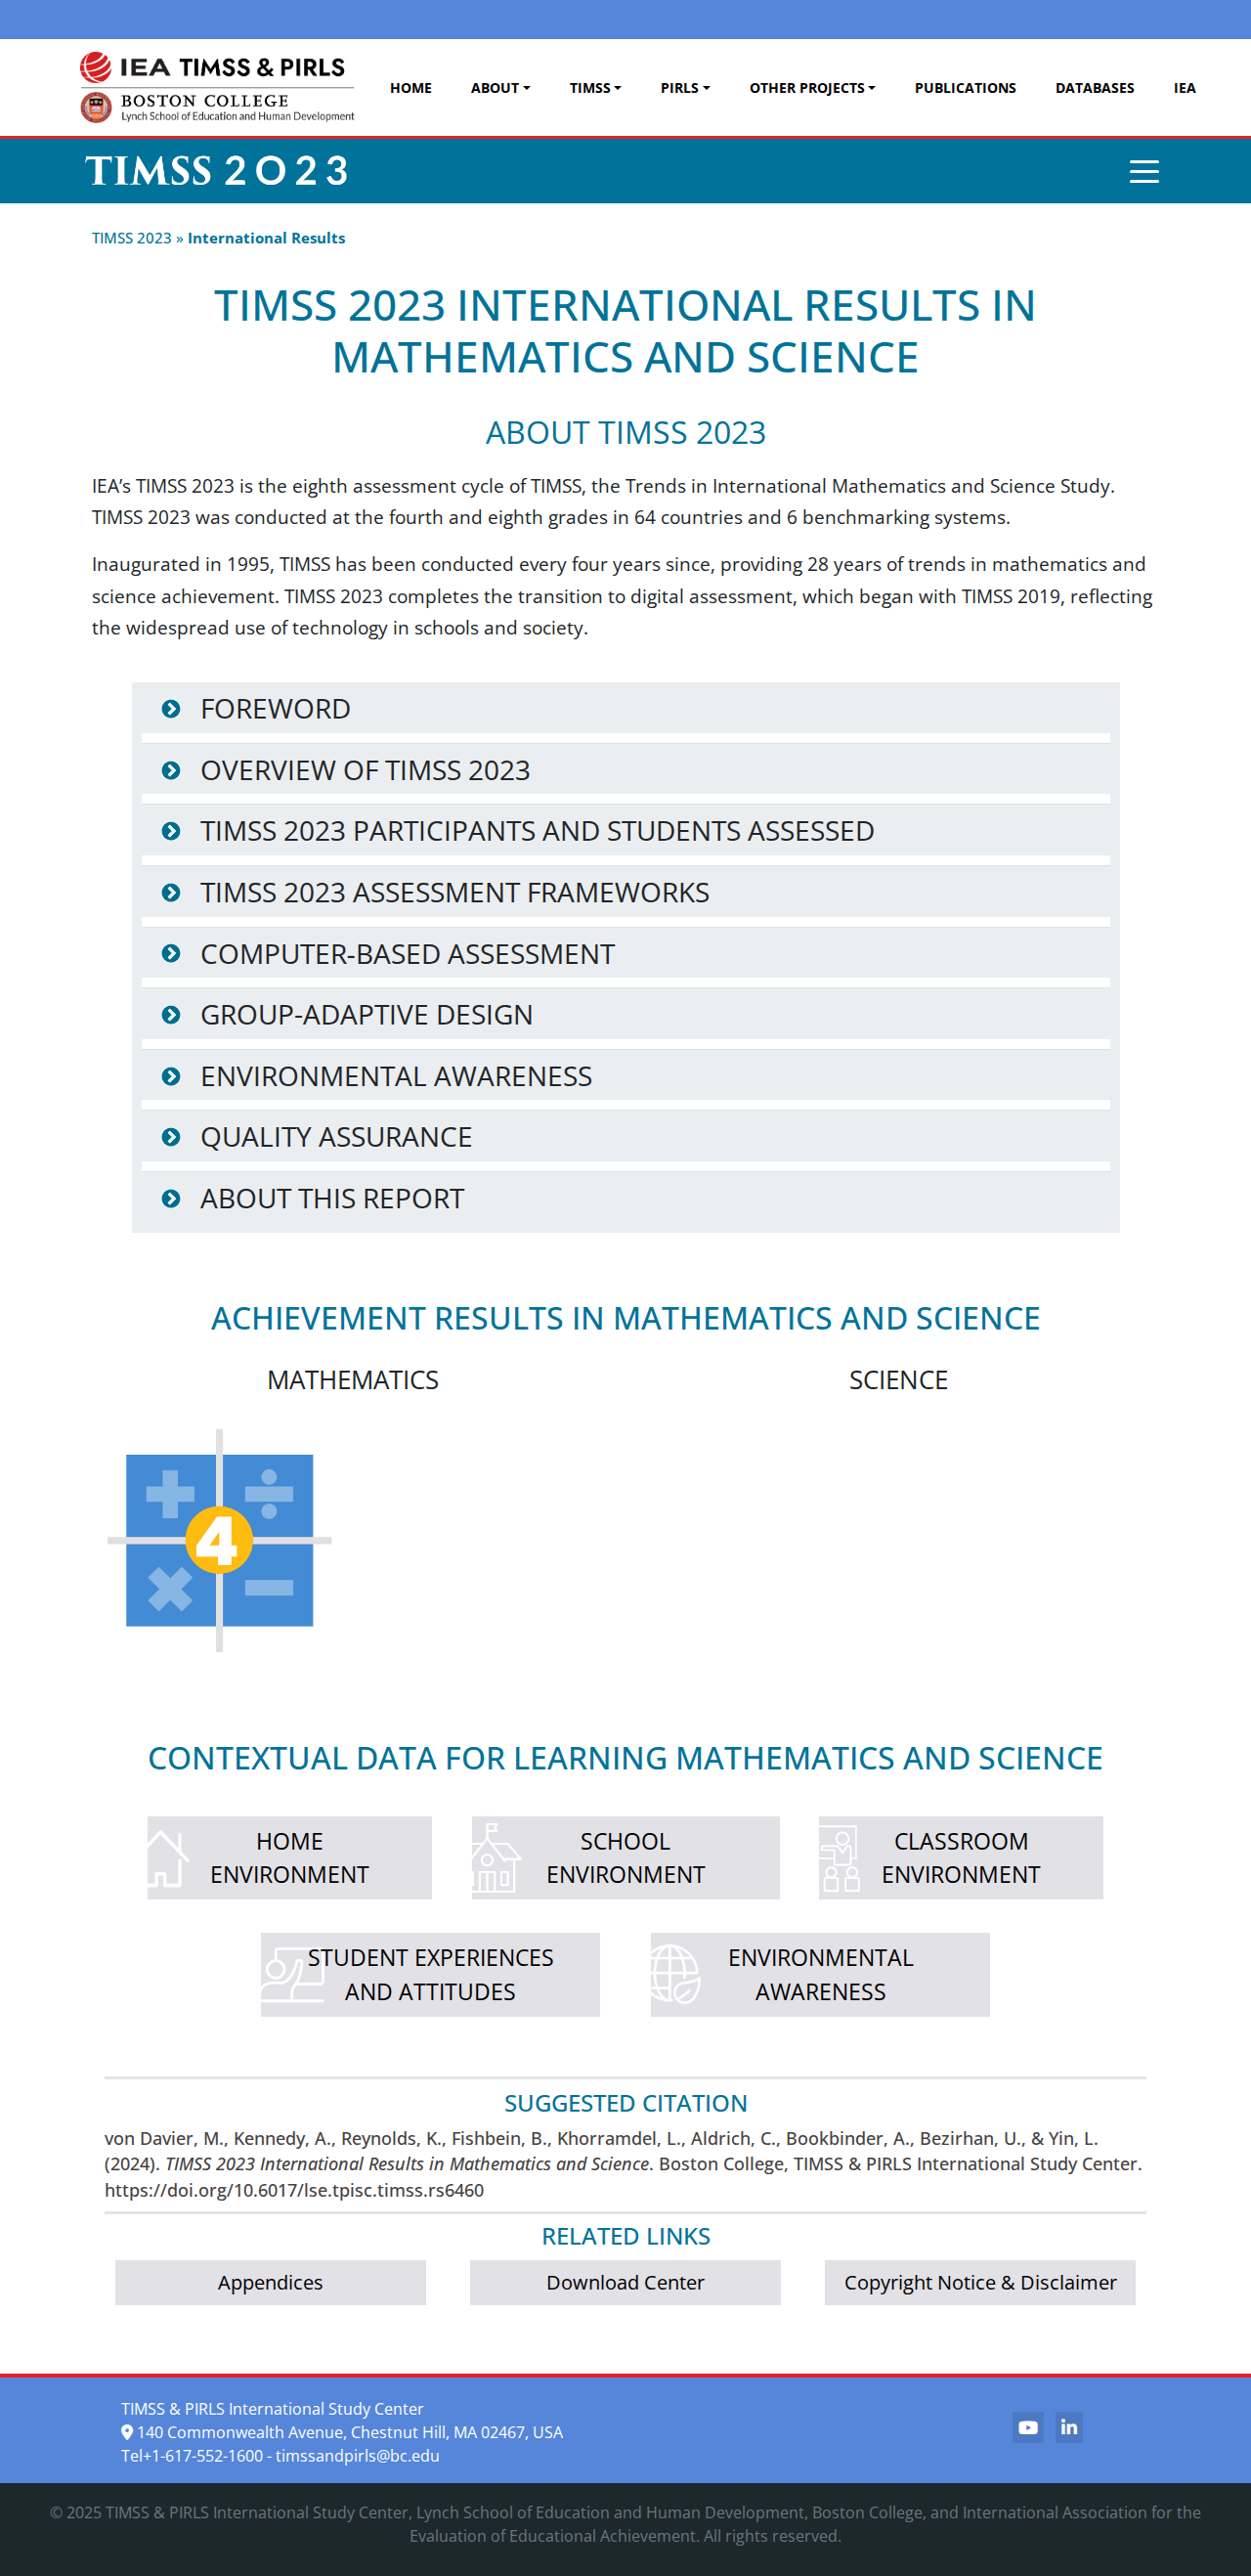
TIMSS 2023 corroboration: South Africa (the most educationally developed SSA country) scored 155 points below the US average in TIMSS 2023 4th-grade mathematics — a gap equivalent to several grade levels. The TIMSS scale is calibrated such that 100 points ≈ approximately 2 years of schooling.
World Bank Learning Poverty data (2022): 86% of SSA children are classified as “learning poor” (unable to read a simple text by age 10) — compared to 57% globally in low-and-middle-income countries, and less than 10% in high-income countries.
ISS Africa Futures: “In sub-Saharan Africa, less than half of students meet the minimum proficiency threshold that is used in the standardised testing, whereas the mean for developed countries is 86%.”
Verdict: ✅ True. The gap is unambiguously “substantial” by every standard measure, under every estimate, from every source — including sources critical of Lynn.
3. “SSA scores are lower than those of other world regions”
✅ True — SSA is consistently the lowest-scoring world region in all major databases
The regional hierarchy from highest to lowest cognitive ability, according to major sources:
| Region | Approximate IQ Equivalent | Source |
|---|---|---|
| East Asia (Singapore, Japan, South Korea, China) | ~105–108 | Lynn/Becker; PISA/TIMSS |
| Europe (Western) | ~98–100 | Multiple sources |
| North Africa / Middle East | ~84–85 | Rindermann; Parra 2025 |
| Latin America | ~79–80 | Rindermann; Parra 2025 |
| South Asia | ~75–80 | Rindermann; Parra 2025 |
| Sub-Saharan Africa | ~69–80 | Lynn/Becker (69); Wicherts (80); Rindermann (~75) |
SSA is the lowest-scoring region in all major analyses. Even under the most generous estimate, SSA trails South Asia, Latin America, the Middle East, Europe, and East Asia.
Verdict: ✅ True. SSA consistently ranks as the world’s lowest-scoring region on all major cognitive/educational assessments.
4. “The gap is an observed fact independent of genetic causation”
✅ True — significant environmental factors are well-established as contributors to depressed cognitive scores in SSA
The claim explicitly states it is not asserting genetic causes. This is an important and defensible position — there are strong, well-documented environmental factors that plausibly explain the observed gap:
Nutrition and iodine deficiency:
- Iodine deficiency is documented to cause an average IQ decline of 12 points (Race and Intelligence, Wikipedia citing multiple studies)
- Iron deficiency anemia affects ~40% of children under 4 in developing countries
- SSA has very high rates of chronic undernutrition, especially in the critical first 2 years of life
- “The first two years of life are critical for malnutrition, the consequences of which are often irreversible and include poor cognitive development” (Race and Intelligence, Wikipedia)
Infectious disease burden:
- High malaria burden impairs brain development; Wicherts found samples from countries with malaria histories had lower scores
- Parasitic load is one of the strongest predictors of national IQ (Eppig, Fincher & Thornhill, 2010)
- Children fighting infectious diseases cannot allocate metabolic energy to brain development simultaneously
Education quality:
- SSA children receive fewer than 7 years of quality schooling on average (Our World in Data)
- A child in Nigeria, Ethiopia, or Chad receives the equivalent of fewer than 5 years of quality learning
- Expert survey (Rindermann et al. 2016): Education was rated the most important factor explaining SSA’s low scores
The Flynn Effect in SSA:
- A Flynn Effect (secular IQ increase) has been documented in Kenya (Daley et al., 2003) and South Africa (Rushton, Skuy & Fridjhon, various)
- SSA IQ gains were 5–9 points per decade in Kenya rural children as conditions improved
- This strongly implies that environmental improvements drive score increases — consistent with an environmental rather than genetic primary explanation
African immigrants in high-resource environments:
- Nigerian and Ghanaian immigrants in the UK often outperform the UK national average at GCSE
- In 2014, Black-African language groups (Yoruba, Igbo, Hausa, Akan) had higher Key Stage 2 Maths pass rates than white British pupils
- In 2017–2018, Black-Africans as a group had a higher percentage of strong passes in English and Maths GCSE (44.3%) than white British pupils (42.7%)
This does not prove environmental causation — immigrant self-selection effects may explain some of this — but it is inconsistent with a purely genetic model and strongly suggests that given access to good nutrition and education, African populations can perform at or above European norms.
Verdict: ✅ True. The observed gap is an empirical measurement that can be stated as a fact. The environmental-factor evidence is substantial and well-documented. The claim is not making a genetic claim, and it would be wrong to assume the data requires one.
5. “Lynn’s specific IQ estimates (~69) are reliable and uncontested”
❌ False — Lynn’s methodology has been subjected to significant published criticism; Wicherts’ estimate of ~80 is the most methodologically defensible
This is NOT actually part of the original claim, but it is important context: the specific figure of “~69” from Lynn is contested.
Key criticisms of Lynn’s methodology:
- The European Human Behavior and Evolution Association (2020) issued a formal statement calling Lynn’s datasets “unscientific” and failing “the expected standard of rigour”
- Wicherts et al. showed that many of Lynn’s higher-scoring African samples were excluded on debatable “unrepresentative” grounds, while lower-scoring samples were included
- Seven scientists writing for Stat (2024) documented that Lynn had an “explicitly racist agenda” and called for retractions of his national IQ work
- Individual country estimates are based on very small, non-probability samples (e.g., school students rather than representative population samples)
- Cultural validity of Western IQ tests in SSA contexts is questioned — tasks relying on 2D diagram analysis (Raven’s Matrices) assume familiarity with Western educational conventions
- Wicherts found that when only methodologically acceptable representative samples were included, SSA average rises to ~80 IQ
The Aporia Magazine analysis (covering the Lynn/Wicherts debate) notes the debate “was never resolved” and that Lynn was accused of excluding studies selectively. However, Lynn’s defenders counter that Wicherts included “elite samples” (private school students) that inflate the average.
Bottom line: The most defensible estimate is approximately 70–80 IQ, with the true value likely in this range. The gap with European norms is either ~1.3 SD (Wicherts) or ~2.0 SD (Lynn). Both are “substantial.”
Verdict: ❌ False as stated (regarding ~69 being definitive and uncontested). However, this does not undermine the broader claim — even Wicherts’ higher estimate confirms a very large gap.
6. “SSA Africans in high-resource environments perform just as poorly”
❌ False — this would be the implication of a strong genetic hypothesis, and the data contradicts it
Again, this is NOT part of the original claim, but it is relevant context:
The Race and Intelligence Wikipedia article documents that in the UK:
- Nigerian-origin pupils: 21.8% above national average for 5 A*–C GCSE grades
- Ghanaian-origin pupils: 5.5% above national average
- Multiple Black-African language groups outperform white British pupils at Key Stage 2 Maths
- Overall Black-African GCSE strong-pass rate (44.3%) exceeds white British rate (42.7%)
This is consistent with a significant environmental contribution to observed score gaps. When SSA-origin populations gain access to high-quality British education, nutrition, and healthcare, their descendants often match or exceed UK average performance.
Verdict: ❌ False as an implicit claim. SSA origin populations placed in high-resource environments show very different outcomes, supporting an environmental explanation for much of the observed gap.
Summary Table
| Sub-claim | Rating | Summary |
|---|---|---|
| Measured cognitive test scores in SSA are lower than Western norms | ✅ True | Confirmed by all major academic analyses and international educational assessments |
| The gap is “substantial” | ✅ True | Even the most optimistic estimate (Wicherts’ ~80 IQ) is ~1.3 SD below European norms |
| SSA scores are lower than other world regions | ✅ True | SSA is lowest-scoring region in all major databases, below East Asia, Europe, MENA, Latin America, South Asia |
| The gap is an observed fact independent of genetics | ✅ True | Environmental factors (nutrition, disease, education quality) are well-documented contributors; Flynn effects observed in SSA |
| Lynn’s ~69 estimate is reliable and uncontested | ❌ False | Wicherts’ systematic review, using stricter methodology, found ~80; Lynn’s methodology has serious criticisms |
| SSA Africans in high-resource environments perform as poorly | ❌ False | Nigerian/Ghanaian immigrants in the UK frequently match or exceed UK national averages |
Overall: ✅ Largely True — The empirical claim that Sub-Saharan Africans have substantially lower average cognitive test scores than other world regions is supported by all major academic analyses regardless of methodological disputes. Every credible source — including those highly critical of Lynn — confirms a very large gap. The exact size is disputed (approximately 20–30 points / 1.3–2.0 SD) but in all cases is correctly described as “substantial.” The claim is limited to the empirical observation and does not assert genetic causation, which is important and appropriate.
References
Primary Sources
-
Lynn, R. & Becker, D. (2019). The Intelligence of Nations Published: 2019 | Accessed: 2026-03-11 URL: https://www.ulsterinstitute.org/ebook/THE%20INTELLIGENCE%20OF%20NATIONS%20-%20Richard%20Lynn,%20David%20Becker.pdf Key finding: SSA average IQ ~69; global hierarchy with East Asia highest and SSA lowest.
-
Wicherts, J.M., Dolan, C.V., & van der Maas, H.L.J. (2010). A systematic literature review of the average IQ of sub-Saharan Africans. Intelligence, 38(1), 1–20. Published: 2010 | Accessed: 2026-03-11 URL: https://jeltewicherts.net/wp-content/uploads/2015/12/wicherts2010iqafr.pdf Key finding: Using representative samples, SSA average IQ is approximately 80 (UK norms); lower than Lynn’s estimate but still substantially below European/East Asian scores.
-
Rindermann, H., Becker, D., & Coyle, T.R. (2016). Survey of Expert Opinion on Intelligence: Causes of International Differences in Cognitive Ability Tests. Frontiers in Psychology (PMC4804158). Published: 2016 | Accessed: 2026-03-11 URL: https://pmc.ncbi.nlm.nih.gov/articles/PMC4804158/ Key finding: 71 intelligence researchers confirmed SSA has the world’s lowest cognitive scores; education rated the most important causal factor.
-
ScienceDaily (2010). Controversial study of African IQ levels is ‘deeply flawed’. Published: 2010-01-21 | Accessed: 2026-03-11 URL: https://www.sciencedaily.com/releases/2010/01/100121155220.htm Key finding: Reports Wicherts’ critique of Lynn; finds African IQ closer to 80 than 67 when representative samples are used.
-
TIMSS 2023 International Results in Mathematics and Science. Published: 2024 | Accessed: 2026-03-11 URL: https://timss2023.org/results/ Key finding: South Africa (most educationally developed SSA country) scores 155 points below the US average in 4th-grade mathematics; Morocco and South Africa are among the lowest-ranked countries.
-
ISS Africa Futures — Education in Sub-Saharan Africa. Published: Various | Accessed: 2026-03-11 URL: https://futures.issafrica.org/thematic/06-education/ Key finding: “Students in sub-Saharan Africa consistently perform worse than students in the rest of the world.” Less than half meet minimum proficiency standards vs 86% in developed countries.
-
Our World in Data — Global Education. Published: Various | Accessed: 2026-03-11 URL: https://ourworldindata.org/global-education Key finding: SSA children receive fewer than 7 years of quality schooling; children in Nigeria, Ethiopia, and Chad receive equivalent of fewer than 5 quality learning years.
-
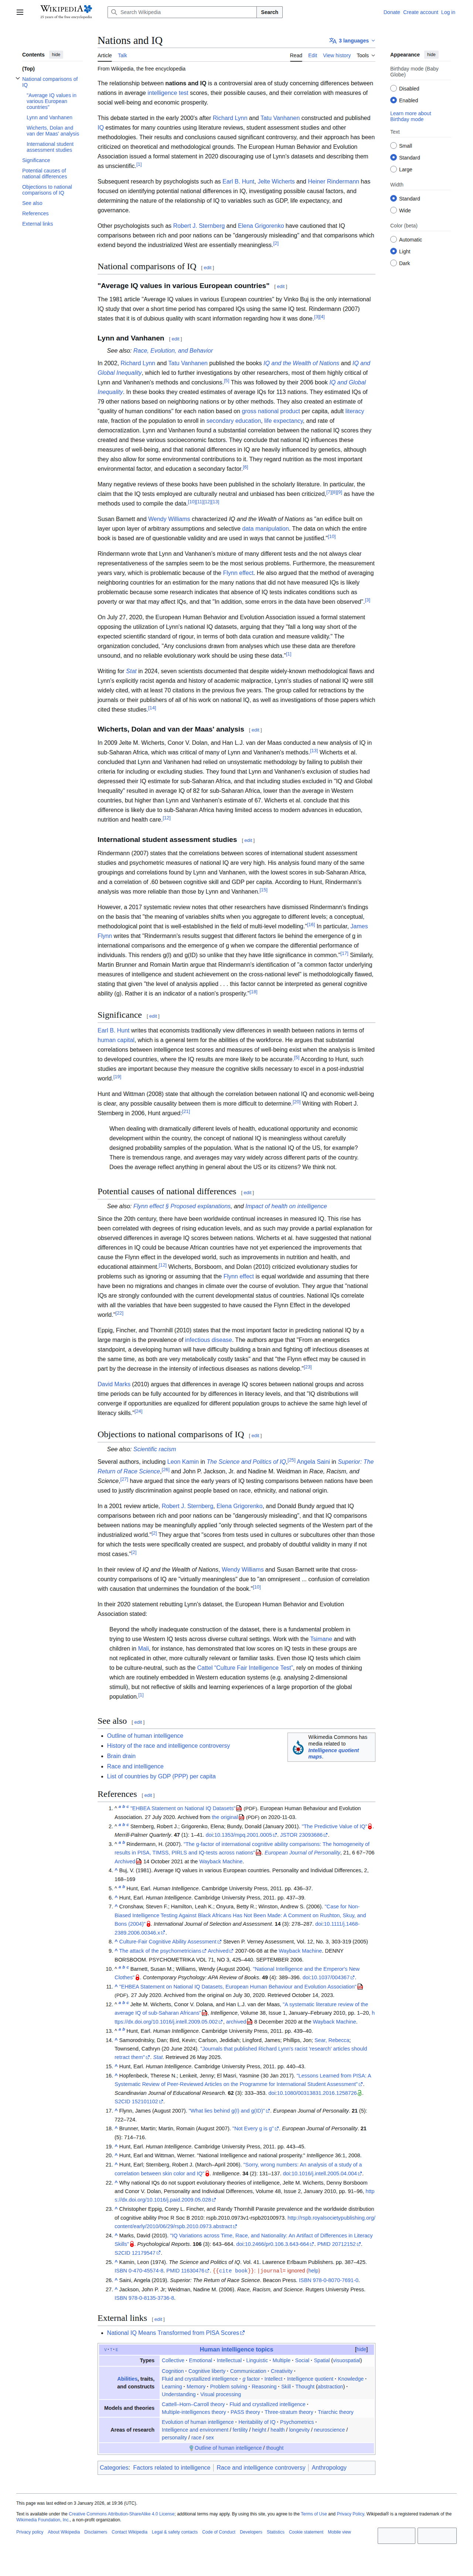
Wikipedia — Nations and IQ. Accessed: 2026-03-11 URL: https://en.wikipedia.org/wiki/Nations_and_IQ Key finding: Comprehensive overview of academic debate; Wicherts 2010 estimated SSA at ~82; European Human Behavior and Evolution Association formally rejected Lynn’s datasets in 2020.
-
Wikipedia — Race and Intelligence. Accessed: 2026-03-11 URL: https://en.wikipedia.org/wiki/Race_and_intelligence Key finding: Documents environmental factors (iodine deficiency −12 IQ pts, lead exposure −7 pts, malnutrition); UK data showing Nigerian/Ghanaian immigrants outperforming white British pupils.
-
Aporia Magazine — Are Richard Lynn’s national IQ estimates flawed? (2023) Published: 2023 | Accessed: 2026-03-11 URL: https://www.aporiamagazine.com/p/are-richard-lynns-national-iq-estimates Key finding: Balanced analysis of the Lynn/Wicherts debate; notes the debate is unresolved but the gap is real; data quality for SSA is lower than for developed countries.
-
Daley, T.C., et al. (2003). IQ on the Rise: The Flynn Effect in Rural Kenyan Children. Psychological Science, 14(3), 215–219. Published: 2003 | Accessed: 2026-03-11 URL: https://pubmed.ncbi.nlm.nih.gov/12741743/ Key finding: First documented Flynn effect in rural SSA; IQ gains of 5–9 points per decade in Kenya as conditions improved, consistent with environmental causation.
-
World Bank (2022). The State of Global Learning Poverty: 2022 Update. Published: 2022 | Accessed: 2026-03-11 URL: https://thedocs.worldbank.org/en/doc/e52f55322528903b27f1b7e61238e416-0200022022/original/Learning-poverty-report-2022-06-21-final-V7-0-conferenceEdition.pdf Key finding: 86% learning poverty rate in SSA (unable to read a simple text by age 10).
Evidence Screenshots
Nations and IQ — Wikipedia overview of academic debate
ScienceDaily — "Controversial study of African IQ levels is deeply flawed" (Wicherts 2010 critique of Lynn)
Expert Survey on Intelligence — Rindermann et al. 2016 (PMC)

ISS Africa Futures — Education outcomes in Sub-Saharan Africa

TIMSS 2023 International Results — South Africa among lowest scorers
Our World in Data — Global Education quality (SSA receives less than 7 years quality schooling)

Race and Intelligence — Wikipedia (environmental factors, UK immigrant data)

Aporia Magazine — Analysis of Lynn vs Wicherts debate

Evidence PDFs
| Source | |
|---|---|
| Wicherts et al. (2010) — Systematic Literature Review of SSA IQ | page.pdf |
| Rindermann et al. (2016) — Expert Survey on Intelligence | page.pdf |
| ScienceDaily — African IQ levels critique | page.pdf |