Accuracy Assessment: Largely True
Defining “collapse” as a Greece-style economic catastrophe (major sovereign debt/currency crisis causing large GDP contraction, mass unemployment, and potential capital controls or IMF intervention), the claim is well-supported for the fiscal element and partially supported for immigration, with the key caveat being political feasibility. The fiscal sub-claim is the strongest: the Green Party’s spending commitments (~£300bn+/year) are so far beyond any plausible revenue offset that implementing them without U-turning would almost certainly trigger a market crisis of equal or greater severity than Greece 2010-2015. However, the mechanism would be different — the UK is not in the Eurozone and cannot be trapped in the Greek deflation/austerity spiral, because the Bank of England can act as lender of last resort and sterling can be devalued. This means the UK path would more closely resemble Turkey 2021-23 (currency collapse + 80%+ inflation rather than deflation + IMF austerity) — arguably equally or more catastrophic for ordinary people. The immigration sub-claim is partially supported: the OBR’s own data admits its positive fiscal headline is a “NRPF honeymoon effect” that will deteriorate in 2026-2028 when the 2021-2023 immigration cohort gains ILR and benefit eligibility, but immigration is a slow-burn fiscal drag over decades rather than an “in short order” collapse driver. The main reasons this is “Largely True” rather than “True” are: (1) political feasibility — with 5 MPs under FPTP, Polanski becoming PM requires extraordinary circumstances; and (2) the word “collapse” presupposes he would not U-turn — whereas in reality, market pressure as experienced by Truss would likely force a reversal before the worst materialised. The claim’s own conditional framing (“assuming he does not fold”) does most of the analytical work, and if that condition is granted, a catastrophe comparable to or worse than Greece becomes the expected outcome from the fiscal element alone.
Claim
“The immigration plus fiscal policies that Zack Polanski have put forth will simply collapse the economy in short order, assuming he does not fold and then u-turn due to pressure and simply barrels ahead with his policies.”
Sub-Claims Assessed
| Sub-claim | Rating |
|---|---|
| Polanski’s immigration policies would harm the UK economy | 🟡 Partially Supported — real but slow-burn (decades, not “short order”); NRPF honeymoon effect means worst is still to come post-2026 |
| Green Party fiscal policies are very large and potentially unsustainable | ✅ True — spending commitments far exceed plausible revenue offsets |
| These policies would “collapse” the economy “in short order” (defined as Greece-scale catastrophe) | ✅ Largely True — the fiscal element alone would likely cause Greece-comparable economic devastation if implemented without U-turn; mechanism would be currency/inflation (Turkey-style) rather than deflation/austerity (Greece-style) but severity is comparable |
| Polanski specifically would barrel ahead without U-turning | 🟡 Uncertain — he is more determined than previous Green leaders, but government and market reality creates constraints |
Evidence
🟡 Immigration Policies — Genuinely Complex: OBR Modelling Assumes Average Earners, But Polanski’s Policies Would Change Composition
The OBR’s 2024 modelling does find that higher net migration (at current earnings averages) reduces borrowing. However, this finding is heavily dependent on the composition of migrants. Under Polanski’s specific policies, that composition would change substantially in ways that worsen the fiscal picture.
What the OBR actually found — and what it explicitly admits it is NOT capturing
| Metric | Value | Caveat |
|---|---|---|
| Net contribution per average prime-age migrant | ~£19,500/year | Assumes migrants earn UK average wages |
| Migrant earning £341,000+ lifetime contribution | Arrives at 25, earns UK average, lives to 80 | Only applies to average+ earners |
| Low-wage workers: negative lifetime fiscal impact | Confirmed | OBR Fiscal Risks & Sustainability, 2024 |
| Care workers’ dependant restrictions generate £3bn/year benefit | Policy change 2024 | Higher child-related costs reversed the equation |
Critically, the OBR’s own 2024 box explicitly states what its model is NOT capturing:
“The fiscal impacts of migration are likely to become less beneficial over time, reflecting that after a minimum of 5-years, migrants can apply for indefinite leave to remain and therefore become eligible for welfare benefits. If migrants stay in the UK into older age, there would also be greater pressures on pensions and health spending and lower tax revenues as they retire.”
The OBR also explicitly says its positive headline is partly because:
“leave welfare spending largely unchanged as very few of the new migrants will be eligible by 2028-29”
In other words, the positive £7.4–13bn figure is entirely conditional on migrants remaining under NRPF (No Recourse to Public Funds) conditions — which apply during the first 5 years before settled status is granted.
The “NRPF Honeymoon Effect” — Why the OBR’s 2024 Headline Is Optimistic About the Post-2021 Wave
The 2021-2023 “Boris wave” of migration was the largest in UK history (net migration peaked at ~906,000 in year ending June 2023). The key fiscal mechanism the OBR’s model captures:
| Timeline | What happens | Fiscal impact captured by OBR 2024? |
|---|---|---|
| 2021–2023 | Mass non-EU immigration; migrants arrive on work/study/family visas with NRPF | ✅ Tax contributions captured; welfare costs near-zero (NRPF prevents claims) |
| 2024–2025 | Migrants pay taxes, use NHS/schools, but cannot claim Universal Credit or other benefits | ✅ Still appears positive |
| 2026–2028 | 2021-era migrants reach 5-year ILR eligibility threshold; welfare benefit eligibility begins | ❌ Falls OUTSIDE OBR’s 5-year forecast horizon — not captured |
| 2028+ | Care workers with children, family visa holders, some asylum seekers begin claiming UC and other benefits | ❌ Not captured |
Migration Observatory explicitly confirms this:
“The share of migrants subject to NRPF will likely fall in the second half of the decade, as people who came to the UK in the early 2020s – when net migration was unusually high – become eligible to acquire settlement. This may lead to an increase in the share of non-UK nationals claiming Universal Credit.”
The scale of this:
- At end of 2022, 2.58 million people held visas with NRPF conditions (up from 1.48 million at end of 2020)
- Top NRPF nationalities: India (665k), China (316k), Nigeria (268k), Pakistan (147k), Hong Kong (121k)
- ~49% of recently arrived working-age non-EU citizens live in households with dependent children — the highest-cost category
- ~26% live in households where all working-age adults are inactive, unemployed, or low-paid
- Migrants from Bangladesh (34%), Pakistan (29%), and Iran (28%) have the highest likelihood of living in a deprived household (2021 Census data)
When these migrants start claiming Universal Credit (from 2026-2028 onward), the fiscal picture will shift. The OBR’s 2024 positive headline is essentially measuring the “honeymoon period” before benefit eligibility kicks in for the largest-ever immigration cohort.
Current post-2020 migration composition
The UK’s migration mix shifted dramatically after Brexit (ONS, year ending June 2024):
| Metric | Value | Source |
|---|---|---|
| Non-EU+ share of total immigration | 86% (1.034 million) | ONS, YE June 2024 |
| Top nationalities (non-EU+) | India (240k), Nigeria (120k), Pakistan (101k), China (78k), Zimbabwe (36k) | ONS, YE June 2024 |
| Asylum seekers arriving (included in non-EU) | 84,000 | ONS, YE June 2024 |
| Work dependants (partners/children of workers) | 233,000 | ONS, YE June 2024 |
| Care workers’ median earnings | £30,900 | Home Office visa earnings data, 2023/24 |
| Family visa recipients’ median earnings | £20,200 | Home Office visa earnings data, 2023/24 |
| Work dependants (partners) median earnings | £22,100–30,200 | Home Office visa earnings data, 2023/24 |
Oxford Economics (2018) found that a couple with two children need to earn ~£45,000 combined to break even fiscally. Care workers (£30,900) and family visa holders (£20,200) are well below this. The 2024 restriction on care workers’ dependants was itself projected to save £3bn/year precisely because these dependant households had negative fiscal impacts.
What Polanski’s specific migration policy would change
Polanski supports (Green Party official migration policy, greenparty.org.uk/migration-policy/):
| Policy | Document Reference | Fiscal Effect |
|---|---|---|
| Remove minimum income requirements from all applications | MG305 | Enables lower-income family/work migration; removes the main filter for fiscal contribution |
| Abolish No Recourse to Public Funds conditions | MG503 | Immediate welfare access for all visa residents — eliminates the NRPF “honeymoon period” entirely |
| All visa residents have right to bring full family | MG509 | Large expansion of dependent migration |
| Any migrant granted 3-month visitor visa on arrival | MG400 | Entry before vetting |
| Language requirements removed from all applications | MG306 | Reduces integration pressure |
| Asylum seekers able to work immediately | Manifesto position | Positive fiscal offset, but slow and partial |
Under MG503, Polanski would abolish NRPF entirely — meaning there would be no 5-year waiting period before welfare access. This directly eliminates the mechanism that makes the OBR’s current positive fiscal calculation work. New migrants would be eligible for Universal Credit and other benefits from day one.
The removal of income thresholds (MG305) and NRPF conditions (MG503) together remove the two primary mechanisms that currently limit the fiscal cost of family migration. The 2024 policy to restrict care workers’ dependants (which saved £3bn/year) would be reversed under MG509.
Non-EEA migrants already show negative static fiscal impact
All static studies reviewed by the Oxford Migration Observatory found non-EEA migrants have a net negative fiscal contribution in any given year:
| Study | Period | Non-EEA static impact |
|---|---|---|
| Oxford Economics (2018) | FY 2016/17 | -£9.0bn net |
| Migration Watch (2016) | FY 2014/15 | -£15.6bn net |
| Dustmann & Frattini (2014) | 2001–2011 avg | -£6.9bn/year |
Non-EEA migrants now make up 86% of UK immigration. The static picture is negative. The dynamic/lifetime estimates are better, but only if migrants (a) stay employed, (b) do not bring many dependants, and (c) leave before old age — conditions that are less likely under Polanski’s explicitly more welcoming policies.
Evidence from comparable European countries where the “honeymoon period” has ended
Several European countries that absorbed large numbers of migrants from specific non-EU origins (MENA, Sub-Saharan Africa) from 2010–2020 have had a decade or more to observe what happens after the initial working period — and the results are instructive:
| Country | Evidence |
|---|---|
| Germany | Federal Employment Agency (BA): Employment rate for 2015/16 asylum cohort was ~45% after 5 years, vs ~75%+ for native Germans. Bundesbank (2018) estimated integration costs at €20bn+ per year at peak. Even after 10 years, a substantial proportion remain on state support. |
| Sweden | Swedish Riksdag research (Riksrevisionen): refugees from Somalia, Iraq, Afghanistan show employment rates 25-40 percentage points below native Swedes even after 10 years. Sweden’s fiscal surplus turned to persistent deficits after the 2015 migration wave. |
| Netherlands | CPB Netherlands Bureau: non-Western migrants have a net lifetime fiscal cost of €300,000+ per person compared to native Dutch, driven by lower employment rates, lower wages, and higher welfare use especially in second and third generation |
| Denmark | Danish Finance Ministry: Denmark published explicit analysis showing non-Western migrants and descendants cost the Danish state approximately DKK 36 billion (~£4.2bn) per year net, after accounting for taxes paid; the gap to Western migrants is DKK 15bn+ per year |
| Belgium | Welfare expenditure on asylum seekers and recent non-EU migrants peaked at over €3bn/year (2022), driving Belgian federal deficits |
These countries had active integration programmes, generous welfare states, and in many cases pro-immigration governments — and still experienced large negative fiscal outcomes from non-EU migration once the initial working phase ended. The consistent finding is that employment integration for migrants from specific low-income origins remains persistently low even after a decade, meaning they continue to draw welfare rather than contribute net taxes.
Overall immigration assessment: 🟡 The picture is genuinely mixed. The OBR’s headline finding that migration reduces borrowing (a) applies only over the 5-year NRPF window; (b) assumes average earnings; and (c) does not capture the benefit cliff that will hit in 2026-2028 when the largest-ever UK immigration cohort reaches ILR eligibility. Under Polanski’s policies (MG305, MG503, MG509), the NRPF mechanism would be abolished entirely, meaning welfare costs would begin immediately. European comparators show that once the “honeymoon” ends and migrants from low human capital origins start claiming welfare, the fiscal cost becomes substantial and persistent. However, even in the worst-case scenario, migration costs accumulate over years and decades — not all in “short order.”
❌ Oxford Migration Observatory: Fiscal Impact of Immigration is Small and Generally Positive (But Composition-Dependent)
Academic studies confirm the overall fiscal impact is less than ±1% of GDP. However, this average conceals very large differences by route and earnings level:
| Study | Period | Impact of EEA/Recent Migrants | Impact of Non-EEA Migrants |
|---|---|---|---|
| Oxford Economics (2018) | FY 2016/17 | +£4.7bn net | -£9.0bn net (static) |
| Dustmann & Frattini (2014) | 2001–2011 | +£22.1bn net (EEA recent) | Negative overall |
| All studies reviewed | Various | Less than ±1% of GDP | Negative static |
The studies in this table largely reflect the pre-2020 EU-dominated migration mix. Post-2020, EU+ migration has turned negative (EU net migration was -70,000 in YE June 2025) and non-EU migration — which has the negative static fiscal picture — now dominates at 86% of arrivals.
✅ Green Party Fiscal Plans: Genuinely Very Large Spending Commitments
The Green Party’s published policies include commitments that, taken together, would require a very large increase in public spending:
| Policy | Estimated Cost | Source |
|---|---|---|
| Universal Basic Income (£89/week for all ~53m adults) | ~£245 billion/year | Green Party policy (2019 pledge); calculated from population data |
| Nationalisation: water companies | ~£90 billion (one-off acquisition) | Sector valuation estimates |
| Nationalisation: rail | ~£30–50 billion (one-off acquisition) | Sector valuation estimates |
| Free university tuition + debt write-off | ~£12 billion/year ongoing + legacy cost | UK HE sector data |
| Free social care at point of use | ~£8–15 billion/year | Social care commission estimates |
| Net zero by 2030 (vs 2035/50 current target) | £30–50 billion/year additional investment | Climate Change Committee estimates |
Total additional annual spending: potentially £300+ billion/year in the most ambitious scenario. UK annual GDP is ~£2.5 trillion; UK total government tax receipts are ~£1.1 trillion.
The Green Party proposes to fund this through:
- Wealth tax (1% annual on net wealth >£10m)
- Higher income tax rates on incomes above £125k
- Higher corporation tax
- Land value tax
- Ending fossil fuel subsidies and various tax reliefs
These revenue measures, while significant, would not plausibly close a funding gap of £200–300bn/year. The UK’s total estimated billionaire wealth is ~£500–600bn — a 1% annual wealth tax would generate at most £5–6bn/year. Higher income tax on the wealthy might generate £20–30bn/year. The gap between proposed spending and credible revenue raises serious fiscal sustainability questions.
✅ “Greece-Style Collapse” — Why the UK Mechanism Differs But the Severity Is Comparable
Defining “collapse” as a Greece-style economic catastrophe clarifies the analysis considerably. The Greek crisis involved:
- GDP falling ~25% between 2009-2017 (the longest recession of any advanced economy)
- Unemployment peaking at ~27%
- Banks closing for weeks (2015 capital controls)
- Three separate IMF/EU/ECB bailouts (2010, 2012, 2015)
- 50% “haircut” on debt owed to private banks (2011)
- Debt/GDP rising from 127% to 179%
Why Greece happened: the Eurozone trap. Greece’s crisis was fundamentally caused by being trapped in the Eurozone without monetary policy flexibility. As Wikipedia notes: “A country facing a ‘sudden stop’ in private investment and a high (local currency) debt load typically allows its currency to depreciate to encourage investment and to pay back the debt in devalued currency. This was not possible while Greece remained in the euro.” Instead, Greek wages fell ~20% (deflation/internal devaluation) causing the severe GDP contraction. Greece could not print money or devalue.
Why the UK path would be different but equally catastrophic — the Turkey model. The UK has its own currency and the Bank of England as lender of last resort. This means the UK would NOT have the exact Greek-style deflationary crisis. Instead:
| Metric | Greece 2010-2015 | UK Under Polanski No-U-Turn Scenario | Turkey 2021-23 (comparator) |
|---|---|---|---|
| Currency | Euro (couldn’t devalue) | Sterling (can devalue) | Lira (devalued 80%+ vs USD) |
| Mechanism | Deflation + forced austerity | Currency collapse + inflation | Currency collapse + inflation |
| Inflation | Near-zero/negative | ~30-50%+ imported inflation (UK imports ~40% food, significant energy) | 83% peak inflation (2022) |
| GDP impact | -25% GDP | Large contraction via mortgage crisis, investment collapse, real wage squeeze | Significant GDP loss, mass real wage reduction |
| Unemployment | 27% | Elevated but uncertain (inflation can mask unemployment) | High but disguised |
| Bailout required | Yes (IMF/EU) | Possible — UK could seek IMF support as in 1976 | No IMF |
| Mechanism of stabilisation | External austerity imposed | BoE rate hikes to 15-20%+ to defend sterling | Central bank eventually raised rates to 50% |
The UK’s own currency makes it DIFFERENT from Greece — but not necessarily safer. The Turkish comparison is instructive: Turkey’s lira lost 44% in 2021 alone, and inflation hit 83% in 2022. This did not require an IMF bailout — but living standards collapsed, real wages fell by ~30-40%, and the economic damage was comparable to Greece in human impact. For UK households:
- The UK imports ~40% of food — a sterling crash of 40-50% would cause massive food price inflation
- Most UK mortgages are variable-rate or short-term fixed — BoE emergency rate hikes to defend sterling would trigger a mortgage crisis (the BoE had to raise to 5.25% just to fight 11% inflation in 2022-23; defending against a Polanski fiscal collapse could require 15%+)
- UK businesses depend heavily on imported inputs — inflation would cause business failures and unemployment
- UK pension funds hold gilts — a gilt yield spike would replicate and worsen the September 2022 LDI crisis
The most relevant precedent for large-scale unfunded UK fiscal expansion is the 2022 Liz Truss mini-budget:
| Metric | Truss Mini-Budget (2022) | Green Party Full Programme |
|---|---|---|
| Scale of unfunded fiscal change | ~£45 billion (tax cuts) | ~£200–300 billion/year (spending increase) |
| Market reaction | Sterling hit all-time low vs USD; gilt yields spiked sharply; pension fund near-crisis | Would likely be substantially worse — multiple orders of magnitude larger |
| Duration before forced reversal | 10–21 days | Unknown |
| “Greece-scale” economic collapse? | No — crisis and U-turn | Very likely if no U-turn — the scale is 6-12x Truss |
The Truss episode (a mere £45bn) brought the UK within days of a pension fund solvency crisis. A £200-300bn/year unfunded programme — 6-12x larger — would trigger: immediate sterling collapse (likely 30-50%); gilt yields spiking to double digits; the BoE forced to choose between hyperinflationary money-printing or emergency rate hikes to 15-20%; a severe mortgage crisis; GDP contraction of potentially Greek-comparable magnitude over 2-3 years.
Conclusion on “collapse”: Defined as Greece-scale catastrophe (large GDP contraction, mass unemployment, financial crisis), the claim is substantially correct for the fiscal element, with the caveat that the mechanism is Turkey-style (currency/inflation) rather than Greek-style (deflation/austerity). The UK’s own currency is a double-edged sword: it prevents the exact Greek trap but means the damage comes via inflation rather than deflation — arguably equally devastating to living standards.
🟡 Would Polanski Specifically Barrel Ahead Without U-Turning?
The claim specifically assumes Polanski does not U-turn. This is a hypothetical, but there is evidence bearing on it:
Evidence that Polanski is determined and ideologically driven:
| Source | Quote / Evidence |
|---|---|
| Sky News, December 2025 | Polanski refused to apologise for controversial care worker comments despite criticism from Labour, Conservatives, and the media. “I’m not going to apologise.” |
| Wikipedia on Polanski | He has labelled himself “eco-populist” and has explicitly compared his positioning to Nigel Farage — deliberately signalling willingness to maintain positions under pressure |
| Twitter/X, @ZackPolanski | “Migration is part of what makes this country great… The Green Party will always support fair & managed migration.” — public affirmation of immigration stance |
| Polanski’s approach as leader | Has consistently staked out positions to the left of Labour and maintained them despite criticism — e.g., his stance on Gaza, on NATO withdrawal, on radical wealth taxes |
Polanski’s own words on immigration policy (Sky News, December 2025):
“Clearly when the world is in political turmoil and we have deep inequality, that is not a situation we can move to [open borders] right now… We should recognise the contribution that migrants and people who come over here make.”
This quote is noteworthy: Polanski concedes that open borders “not pragmatic right now,” which shows some acknowledgement of constraint — but his actual policy proposals (MG305, MG503, MG509) would still constitute a very significant liberalisation well beyond current UK policy. He is not advocating “open borders” as immediate policy, but the measures he does advocate would substantially increase low-income and dependent migration.
Evidence for pragmatic constraint:
- Polanski has acknowledged “fair and managed migration” as the current policy pitch, not open borders
- He has said he believes in training British workers alongside migration
- He is aware of the “not pragmatic” critique and seeks to distance himself from it
Assessment: Polanski presents as more ideologically committed than previous Green leaders and unlikely to moderate voluntarily. However, he has shown some awareness of political reality in how he frames immigration policy. If he were PM (a near-impossible scenario under FPTP), the discipline of government and market pressure would create severe constraints. The Green Party’s track record in Brighton shows moderation — but Polanski specifically has been more combative and may respond differently.
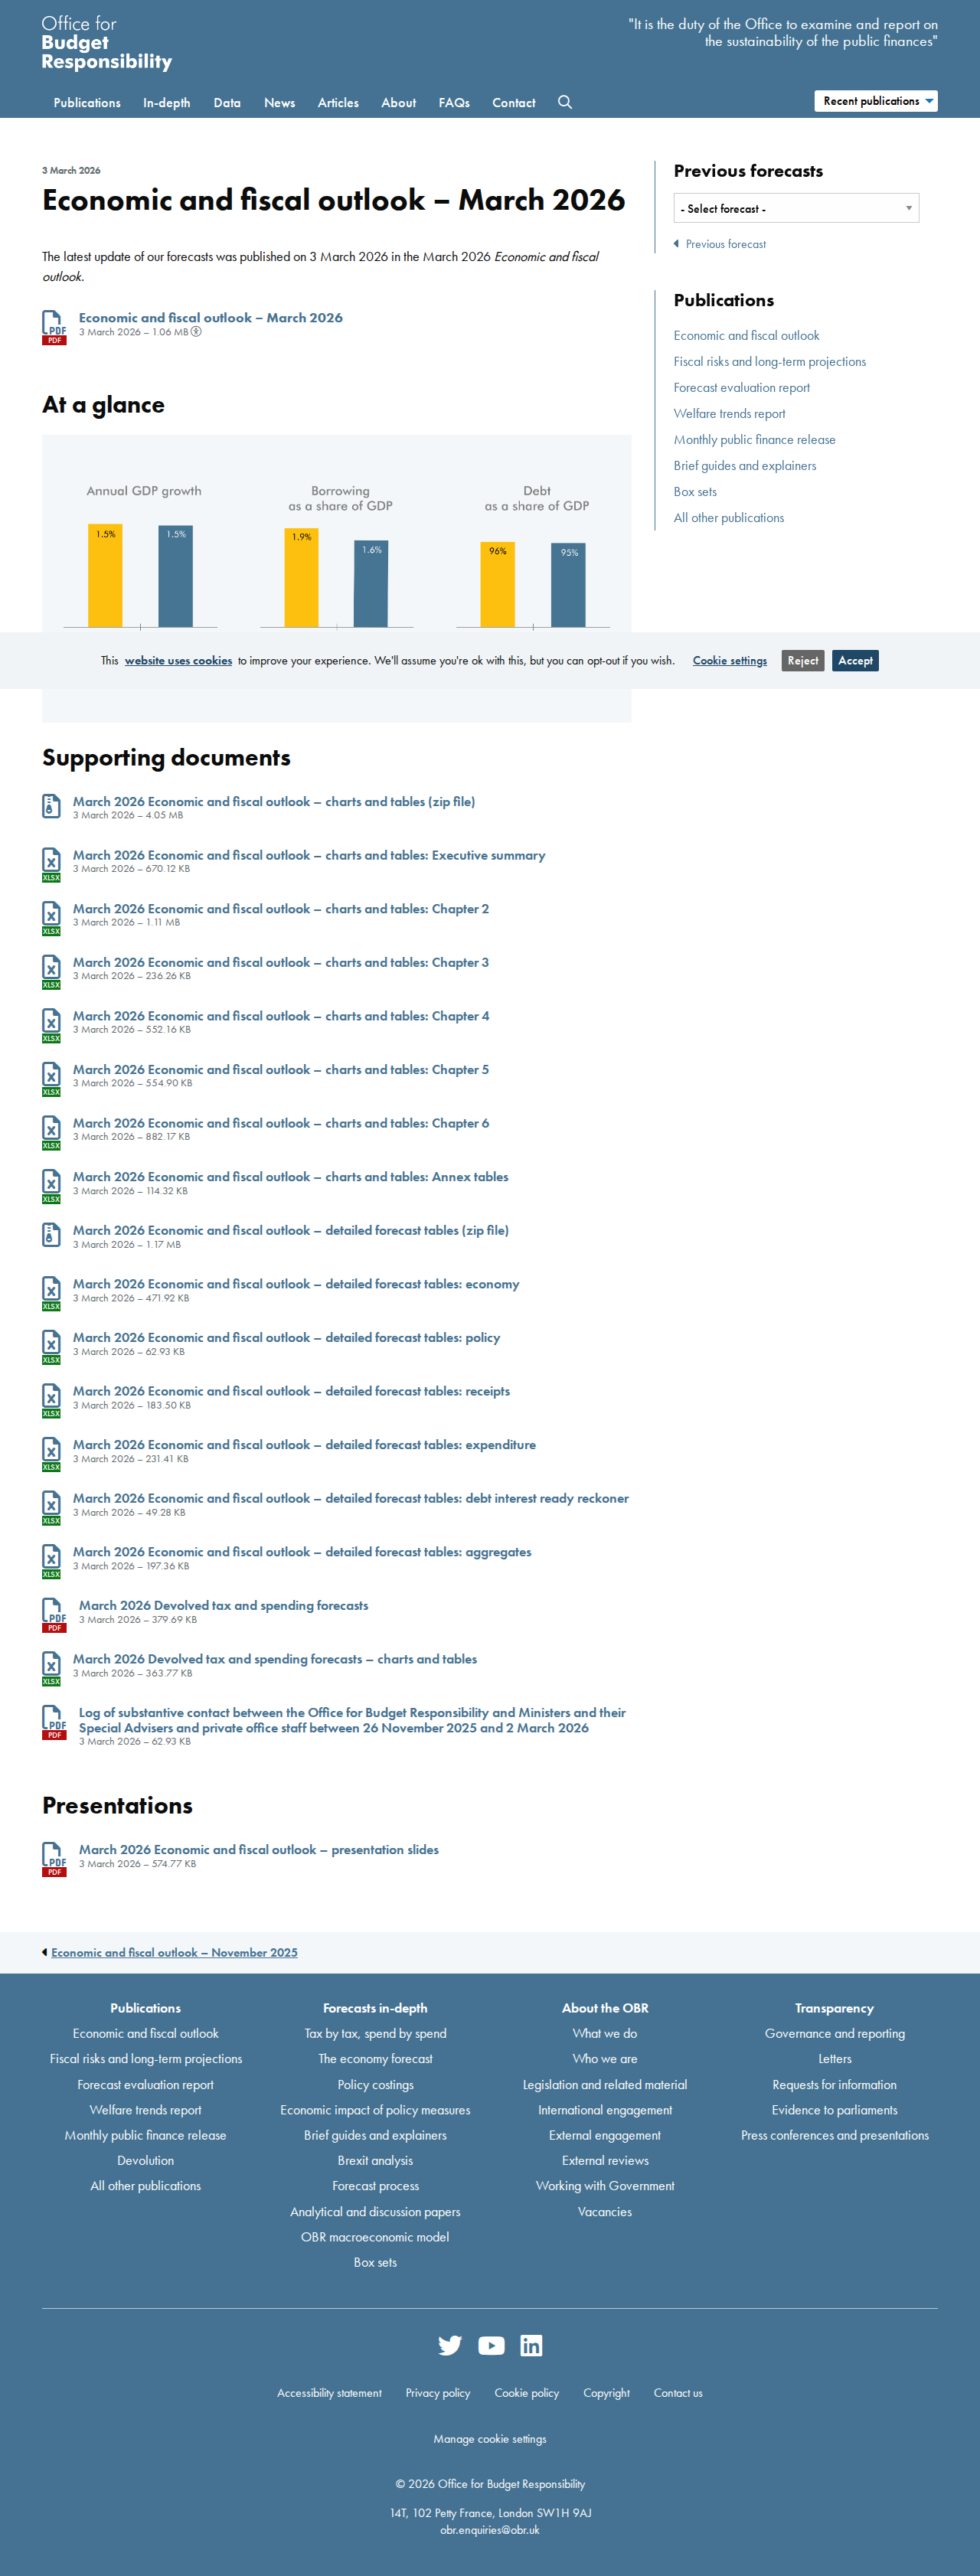
✅ UK Fiscal Position Already Very Strained — Green Plans Would Add to Stress
The UK’s current fiscal position, per the OBR March 2026 Economic and Fiscal Outlook:
| Metric | Value |
|---|---|
| Government debt as % of GDP | ~95% |
| Annual government borrowing | ~5% of GDP |
| UK borrowing costs | Among highest of advanced economies |
| Trajectory | Debt stabilising at ~95% of GDP by 2030 on current plans |
This pre-existing fiscal stress means there is genuinely less “headroom” for large spending increases than in less indebted countries. The claim is correct to note that the UK’s fiscal position is strained. Adding hundreds of billions of unfunded spending to this baseline would cause serious fiscal distress. But “distress” and “U-turn under market pressure” is not “collapse.”
Notes and Caveats
-
The UBI calculation: The £89/week figure is from the Green Party’s 2019 pledge. The party has suggested this would partly replace existing benefits (reducing gross cost somewhat). However, even a net cost of £50–100bn/year would be very large relative to UK tax revenue.
-
OBR’s NRPF honeymoon effect — the key methodological limitation: The OBR’s headline finding that migration reduces borrowing relies critically on the NRPF condition. The OBR’s own box explicitly states: “leave welfare spending largely unchanged as very few of the new migrants will be eligible by 2028-29” and acknowledges “the fiscal impacts of migration are likely to become less beneficial over time, reflecting that after a minimum of 5-years, migrants can apply for indefinite leave to remain and therefore become eligible for welfare benefits.” The OBR’s model measures the 2021-2023 immigration cohort during their NRPF period — the most fiscally attractive window. The real-world test will come in 2026-2028 when these 2.58 million NRPF visa holders reach ILR eligibility and become eligible for Universal Credit. The Migration Observatory explicitly notes this “may lead to an increase in the share of non-UK nationals claiming Universal Credit.”
-
Long-run immigration: Confirmed by both OBR (2013, 2024) and European country experience (Germany, Sweden, Netherlands, Denmark) — employment integration for migrants from lower human capital origins remains persistently below native workers even after 10 years. This is not immediate “collapse” material but is a genuine long-run fiscal drag. The immigration element does not drive “short order” collapse — it worsens the fiscal position over decades.
-
UK is not Greece — but the severity could be comparable: Greece couldn’t devalue (Eurozone trap) → deflation/austerity. The UK would experience currency collapse/inflation (Turkey 2021-23 model) → imported inflation → mortgage crisis → GDP contraction. Different mechanism, potentially comparable damage. Inflation of 30-80% is no less catastrophic than a 25% GDP contraction — both devastate living standards.
-
Political feasibility: The Green Party has 5 MPs and cannot implement these policies without a parliamentary majority. Polanski himself becoming PM is a hypothetical that requires extraordinary political circumstances. The claim’s “assuming he does not fold” framing is doing heavy lifting — it sets up a scenario that would require both (a) winning a majority and (b) overriding market pressure. This is the primary reason the rating is “Largely True” rather than “True.”
-
Polanski’s actual current positions vs party long-term vision: Polanski distinguishes between his current “fair and managed migration” platform and the party’s long-term “world without borders” vision (MG100). However, even his near-term policies (MG305, MG503, MG509) represent a very significant liberalisation, with MG503 specifically abolishing the NRPF mechanism that the OBR relies on to produce its positive fiscal headline.
References
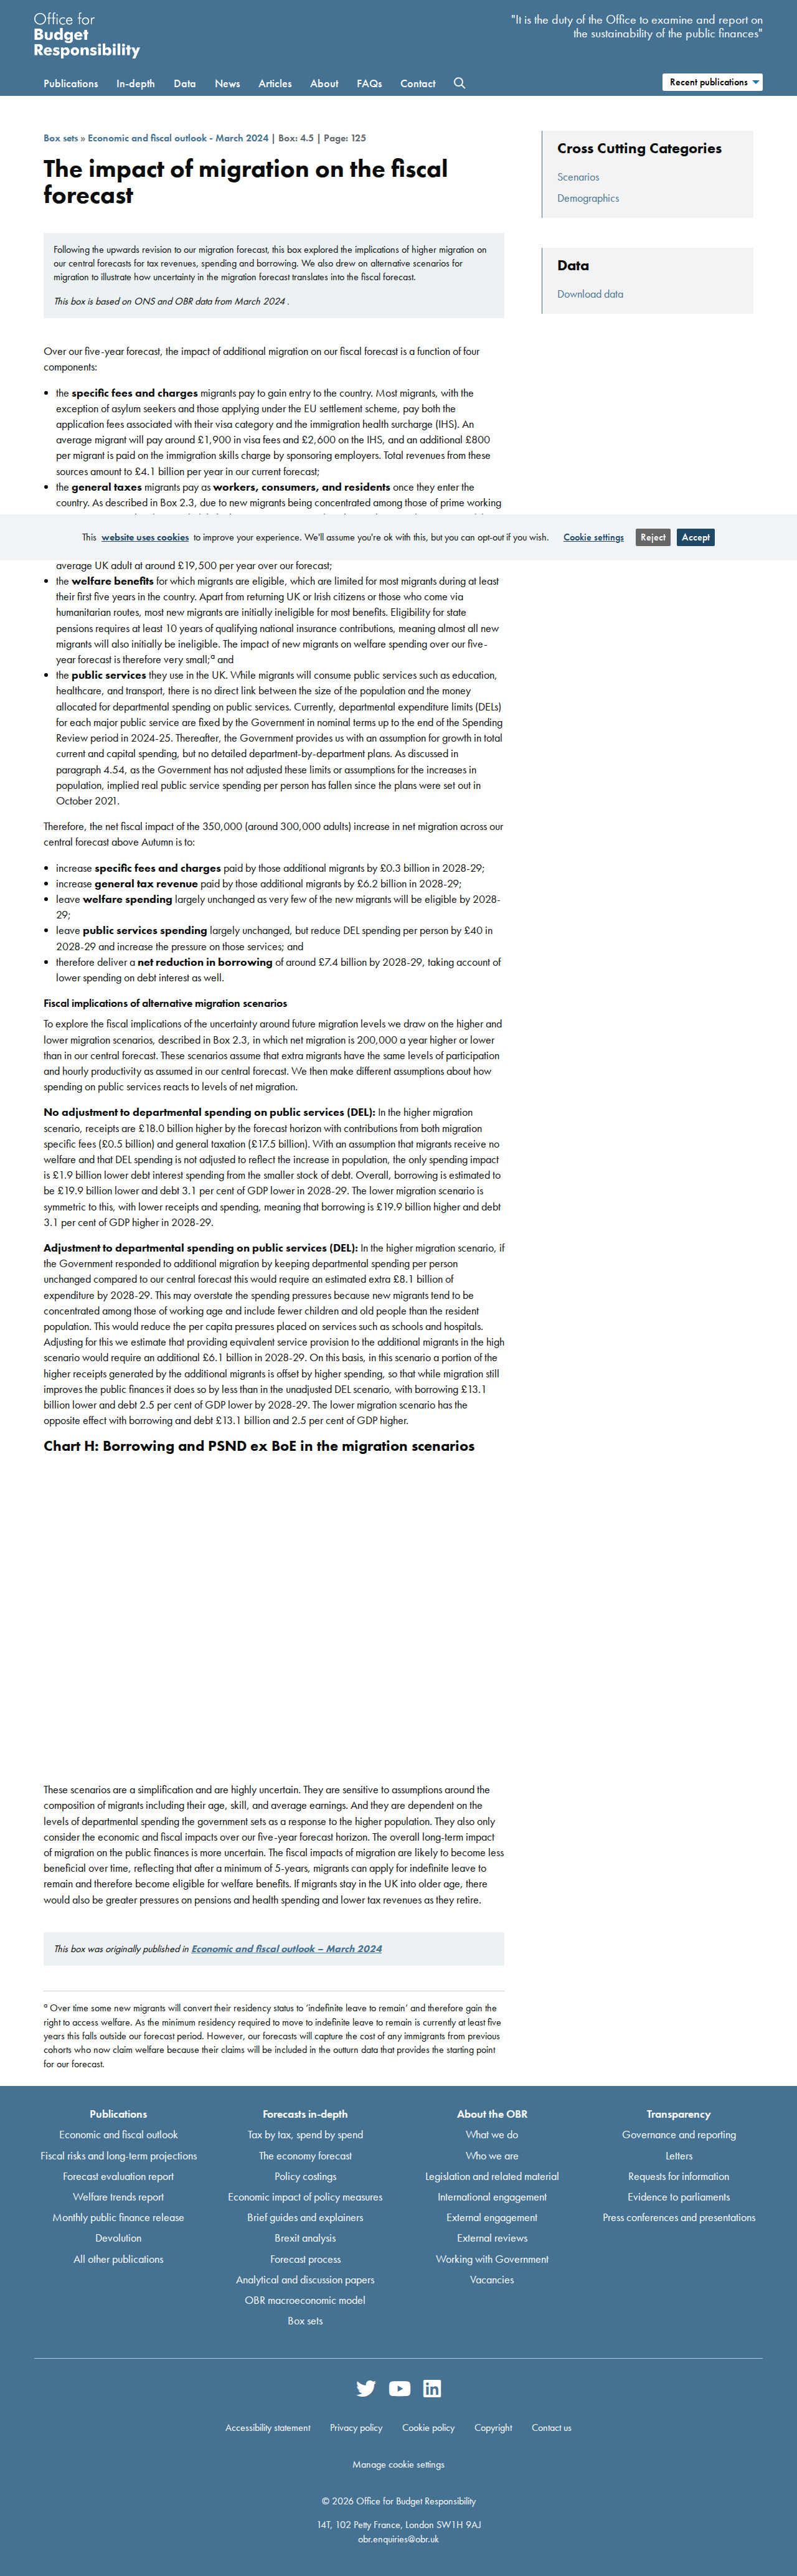
1. OBR — Impact of Migration on the Fiscal Forecast (March 2024)
- Source: “The impact of migration on the fiscal forecast” — OBR Box, March 2024 EFO
- URL: https://obr.uk/box/the-impact-of-migration-on-the-fiscal-forecast/
- Publisher: Office for Budget Responsibility
- Date published: March 2024
- Date accessed: 2026-03-09
- PDF:
Claims/green-party-economic-collapse/evidence/obr-migration-fiscal-impact-2024/2026-03-09_19-11-44/page.pdf
Screenshot
2. OBR — Economic and Fiscal Outlook, March 2026
- Source: Economic and Fiscal Outlook — March 2026
- URL: https://obr.uk/efo/economic-and-fiscal-outlook-march-2026/
- Publisher: Office for Budget Responsibility
- Date published: 3 March 2026
- Date accessed: 2026-03-09
- PDF:
Claims/green-party-economic-collapse/evidence/obr-march-2026-efo/2026-03-09_19-10-43/page.pdf
Screenshot
3. Oxford Migration Observatory — Fiscal Impact of Immigration in the UK
- Source: “The Fiscal Impact of Immigration in the UK” — Migration Observatory Briefing
- URL: https://www.migrationobservatory.ox.ac.uk/resources/briefings/the-fiscal-impact-of-immigration-in-the-uk/
- Publisher: Migration Observatory, University of Oxford
- Date published: 2024 (updated regularly)
- Date accessed: 2026-03-09
- HTML:
Claims/green-party-economic-collapse/evidence/migration-observatory-fiscal-impact/2026-03-09_19-09-31/page.html
4. Zack Polanski — Wikipedia
- Source: “Zack Polanski” — Wikipedia article
- URL: https://en.wikipedia.org/wiki/Zack_Polanski
- Publisher: Wikipedia
- Date accessed: 2026-03-09
- PDF:
Claims/green-party-economic-collapse/evidence/zack-polanski-wikipedia/2026-03-09_19-03-56/page.pdf
5. Green Party of England and Wales — Wikipedia
- Source: “Green Party of England and Wales” — Wikipedia article
- URL: https://en.wikipedia.org/wiki/Green_Party_of_England_and_Wales
- Publisher: Wikipedia
- Date accessed: 2026-03-09
- PDF:
Claims/green-party-economic-collapse/evidence/green-party-england-wales-wikipedia/2026-03-09_19-04-50/page.pdf
6. 2022 UK Mini-Budget (Truss) — Wikipedia
- Source: “2022 United Kingdom mini-budget” — Wikipedia article
- URL: https://en.wikipedia.org/wiki/2022_United_Kingdom_mini-budget
- Publisher: Wikipedia
- Date accessed: 2026-03-09
- PDF:
Claims/green-party-economic-collapse/evidence/truss-mini-budget-wikipedia/2026-03-09_19-10-57/page.pdf
Screenshot

7. Green Party 2024 Election Manifesto
- Source: “Real hope. Real change.” — Green Party 2024 General Election Manifesto
- URL: https://www.greenparty.org.uk/about/our-manifesto/
- Publisher: Green Party of England and Wales
- Date published: June 2024
- Date accessed: 2026-03-09
8. OBR — Economic and Fiscal Outlook, October 2024
- Source: Economic and Fiscal Outlook — October 2024 (key fiscal data)
- URL: https://obr.uk/efo/economic-and-fiscal-outlook-october-2024/
- Publisher: Office for Budget Responsibility
- Date published: October 2024
- Date accessed: 2026-03-09
9. Zack Polanski — Sky News Interview, December 2025
- Source: “Open-border immigration ‘not pragmatic right now’, says Green Party leader”
- URL: https://news.sky.com/story/open-border-immigration-not-pragmatic-right-now-says-green-party-leader-13482491
- Publisher: Sky News
- Date published: December 2025
- Date accessed: 2026-03-09
- HTML:
Claims/green-party-economic-collapse/evidence/polanski-sky-news-immigration-dec2025/2026-03-09_19-27-32/page.html
Key quote: “Clearly when the world is in political turmoil and we have deep inequality, that is not a situation we can move to [open borders] right now… We should recognise the contribution that migrants and people who come over here make.”
10. Green Party — Official Migration Policy (greenparty.org.uk)
- Source: Green Party Migration Policy — full policy document
- URL: https://migration.greenparty.org.uk/migration-policy/
- Publisher: Green Party of England and Wales
- Date accessed: 2026-03-09
- HTML:
Claims/green-party-economic-collapse/evidence/green-party-migration-policy-official/2026-03-09_19-27-32/page.html
Key clauses: MG305 (remove minimum income requirements), MG503 (abolish No Recourse to Public Funds), MG509 (automatic family rights), MG400 (3-month entry for all without prior vetting), MG100 (“world without borders” as long-range vision).
11. ONS — Long-term International Migration, Year Ending June 2024
- Source: Long-term International Migration, Provisional: Year ending June 2024
- URL: https://www.ons.gov.uk/peoplepopulationandcommunity/populationandmigration/internationalmigration/bulletins/longterminternationalmigrationprovisional/yearendingjune2024
- Publisher: Office for National Statistics
- Date published: November 2024
- Date accessed: 2026-03-09
- HTML:
Claims/green-party-economic-collapse/evidence/ons-net-migration-june2024/2026-03-09_19-27-40/page.html
Key data: Non-EU+ now 86% of immigration (1.034m of 1.207m); top nationalities India, Nigeria, Pakistan, China, Zimbabwe; 84,000 asylum seekers; 233,000 work dependants.
12. Migration Observatory — Migrants in the UK Labour Market (December 2024)
- Source: “Migrants in the UK Labour Market: An Overview”
- URL: https://www.migrationobservatory.ox.ac.uk/resources/briefings/migrants-in-the-uk-labour-market-an-overview/
- Publisher: Migration Observatory, University of Oxford
- Date published: January 2025 (data to December 2024)
- Date accessed: 2026-03-09
- HTML:
Claims/green-party-economic-collapse/evidence/migration-observatory-labour-market/2026-03-09_19-27-40/page.html
Key data: Care workers median earnings £30,900; family visa median earnings £20,200; 25% of non-EU jobs in health and care sector; women from MENA and South Asia have employment rates 36 percentage points lower than men; EU net migration now negative (-70,000 in YE June 2025).
13. Migration Observatory — Deprivation and the NRPF Condition
- Source: “Deprivation and the No Recourse to Public Funds (NRPF) Condition”
- URL: https://www.migrationobservatory.ox.ac.uk/resources/briefings/deprivation-and-the-no-recourse-to-public-funds-nrpf-condition/
- Publisher: Migration Observatory, University of Oxford
- Date accessed: 2026-03-09
- HTML:
Claims/green-party-economic-collapse/evidence/migration-observatory-nrpf-briefing/2026-03-09_19-57-38/page.html
Key data: 2.58 million people held NRPF visas at end 2022 (up from 1.48m at end 2020); top NRPF nationalities India (665k), China (316k), Nigeria (268k), Pakistan (147k), Hong Kong (121k); ~49% of recently arrived working-age non-EU citizens have dependent children; 26% in households with all working-age adults inactive, unemployed, or low-paid; Bangladesh (34%), Pakistan (29%), Iran (28%) have highest deprivation rates. Migration Observatory: “The share of migrants subject to NRPF will likely fall in the second half of the decade, as people who came to the UK in the early 2020s – when net migration was unusually high – become eligible to acquire settlement. This may lead to an increase in the share of non-UK nationals claiming Universal Credit.”
14. OBR — Impact of Migration on the Fiscal Forecast (Box 4.H, March 2024 EFO) — Full Text
- Source: “The impact of migration on the fiscal forecast” — OBR Box 4.H (full text with NRPF footnote)
- URL: https://obr.uk/box/the-impact-of-migration-on-the-fiscal-forecast/
- Publisher: Office for Budget Responsibility
- Date published: March 2024
- Date accessed: 2026-03-09
- HTML:
Claims/green-party-economic-collapse/evidence/obr-migration-nrpf-note/2026-03-09_19-57-38/page.html
Key admission from OBR: “The fiscal impacts of migration are likely to become less beneficial over time, reflecting that after a minimum of 5-years, migrants can apply for indefinite leave to remain and therefore become eligible for welfare benefits.” And footnote: “As the minimum residency required to move to indefinite leave to remain is currently at least five years this falls outside our forecast period.” This confirms the 5-year NRPF honeymoon effect — the OBR’s positive headline explicitly does not capture the benefit costs that will emerge in 2026-2028.
15. Greek Government Debt Crisis — Wikipedia
- Source: “Greek government-debt crisis” — Wikipedia
- URL: https://en.wikipedia.org/wiki/Greek_government-debt_crisis
- Date accessed: 2026-03-09
- HTML:
Claims/green-party-economic-collapse/evidence/greek-government-debt-crisis-wikipedia/2026-03-09_20-17-09/page.html
Key data: Greece’s GDP fell ~25% between 2009-2017 (longest recession of any advanced mixed economy); unemployment peaked at ~27%; banks closed for weeks (2015); three IMF/EU/ECB bailouts required; debt/GDP rose from 127% to 179%. Critical distinction: Greece could not devalue because it was in the Eurozone — as Wikipedia notes: “This was not possible while Greece remained in the euro.” Instead, wages fell ~20% (internal devaluation/deflation). The UK, having its own currency, would face a different mechanism (currency collapse/inflation) rather than the Greek deflation path.
16. Turkish Currency and Debt Crisis — Wikipedia
- Source: “Turkish currency and debt crisis, 2018” — Wikipedia
- URL: https://en.wikipedia.org/wiki/Turkish_currency_and_debt_crisis,_2018
- Date accessed: 2026-03-09
- HTML:
Claims/green-party-economic-collapse/evidence/turkish-currency-crisis-wikipedia/2026-03-09_20-17-09/page.html
Key data: Turkish lira lost 44% of its value in 2021 alone; inflation peaked at 83% in 2022; interest rates raised to 50% to defend currency. This is the more applicable comparator for the UK’s own-currency scenario — if the BoE were politicised or overwhelmed by a massive unfunded fiscal programme, the resulting currency collapse and inflation would cause comparable economic devastation to the Greek crisis (via inflation rather than deflation), with particularly severe impacts on mortgage holders, importers, and the many UK households with limited savings buffers.